Getting started with Q-SoPrA
Introduction
As I mentioned in my previous post, I am currently working on an integrated software package for the qualitative study of social processes, called Q-SoPrA (Qualitative Social Process Analysis). The program can be used for various tasks, including data management, qualitative coding, and visualisation. It is still under construction, and I have not opened the source or distributed any binaries yet (but I will once a more or less fully-featured and stable version is ready). In addition to some more technical posts about the software (such as the previous one), I intend to write several non-technical posts, discussing the features of Q-SoPrA and how to use them. Eventually, most of this information will also be available from the GitHub wiki of Q-SoPrA, but I think having some less condensed discussions of features is also useful.
Also...
I understand that having posts like this one will be more useful once the software is actually released, but for me writing this post is a way to prepare for the release, as well as a way to document some thoughts that might help me decide how to improve things further.
In this post, I want to discuss the basics of how to get started with Q-SoPrA. I start with a discussion of the logic behind the kind of data that Q-SoPrA works with. Then, I discuss the creation and loading of data sets, as well as data management (e.g., entering data, editing data, importing data).
Incidents as data points
I usually refer to the data sets that Q-SoPrA works with as event data sets, because it gives an intuitive sense of the kind of data stored in them, but the name incident data sets is actually more appropriate. The data sets consist of chronologically ordered incidents, which are bracketed, qualitative descriptions of interest to the process under study. The concept of incidents was, as far as I can tell, invented during the Minnesota Innovation Research Program (also see this book for detailed instructions on how to construct data sets like those used during the program, and this book for some empirical results of the program).
The operational definition of an incident that I use, and that I implemented in Q-SoPrA, is slightly different from that of the original inventors of the concept. In Q-SoPrA, an incident is assumed to include the following information:
- A description of the activity captured in the incident (created by the analyst).
- An indication of the time of occurrence (e.g., the hour, the day, the month, the year).
- The source of data.
- (Optionally / if available) A fragment of ‘raw’ data, such as a fragment from an interview transcript, or a passage from a document in which the activity is reported.
- (Optionally) A comment / memo written on the incident by the researcher.
I discuss each of these elements in more detail below.
Description
Incidents are supposed to capture activities of importance to the process under study. Indeed, what exactly these activities are depends on various factors, including characteristics of the process, the nature of the available data (e.g., granularity of data), the research questions of the analyst, the theoretical angle chosen for the study, and so on (see the earlier mentioned references, and also see this, this (and other) work by Abbott for good discussions on this matter).
Moreover, not all social processes are best reconstructed at the same level of abstraction. Some studies may be about processes that unfold over a period of several years (e.g., innovation processes), whereas other processes unfold over a period of just a few hours (e.g., a meeting), or even just a few minutes (e.g., a conversation). The level of detail available in the source data, and the desired level of detail of incident descriptions is quite different across different types of processes.
The activities of interest are captured in brief descriptions (typically just a few sentences), created by the researcher. These descriptions typically mention at least what activity was performed, and by whom. Providing such descriptions is mandatory when using Q-SoPrA.

Writing incidents is an important step in the analytic process, and the descriptions used for incidents tell us a lot about the analyst’s interpretations of the raw data. As Poole and his colleagues write, incidents can be understood to be “one step above the raw material for analysis” (page 140). When parsing the raw data into incidents, the analyst makes various decisions about, among other things (1) what activities are important to record explicitly, (2) the granularity of the activities (e.g., are we just interested in the occurrence of a political debate, or are we interested in the specific questions raised during the debate, and how people responded to these?), (3) what aspects of the described activity are important (do we only need to record the activity itself, or perhaps also, for example, where the activity took place and what instruments were used in the performance of the activity?).
In the Minnesota Innovation Research Program, the researchers agreed on a set of explicit decision rules that were applied across the different cases that they studied. I believe that making explicit decision rules is valuable for the transparency of the process, but I also believe that an important part of the interpretive process is to reconsider these choices repeatedly, and to make adjustments to the data set accordingly. It is important to record such decisions in some kind of research diary (Q-SoPrA includes a Journal Widget that can be used for this purpose).
Time of occurrence
As I mentioned before, incidents are chronologically ordered in data sets. The order is to be determined by the analyst. I did not implement automatic sorting of incidents by date in Q-SoPrA, since the precise date of an incident may not be known, and a more descriptive indication of the time of occurrence is then required. For example, of some incidents we may only know that they happened before or after a certain other incident. In addition, I believe that determining the appropriate order of incidents is an important and informative task from which the analyst can learn a lot about the process of interest.
That being said, Q-SoPrA requires the analyst to always provide an indication of the time of occurrence. This may be a very precise time stamp (e.g., “At 15:30 on 25-12-2017”), or it may be a very vague indication of the time of occurrence (e.g., “Somewhere in 2013”). It may of course also be some form of duration, rather than a discrete point in time (e.g., “from March to April 2016”).
The sources of data
Q-SoPrA also requires you to always mention the sources of data. For most academics, this is a bit of a no-brainer. The specific sources of data used will depend on the design of the research project. In the studies included in the Minnesota Innovation Research Program, which were carried out as the innovations of interest unfolded, sources of data include observations, records of phone calls, notes of meetings, interview transcripts, and others.
I typically work with archival data, including newspaper articles, documents produced by people involved in the process of interest (e.g., minutes of meetings or project documents), as well as web sites (I make heavy use of The Internet Archive). I store files on these sources on my disk, and typically give them simple labels, such as “Webpage_1”, “Document_20”, “News_101” and so on. In the data set, I refer to these sources by their labels.
‘Raw’ data
As much as possible, I also like to include fragments from raw sources of data whenever I create incidents. I believe that including these ‘raw’ fragments alongside my own descriptions of the activities contributes to the transparency of the interpretive process. Also, when I assign codes to the incidents, these fragments of ‘raw’ data are my main pieces of evidence. In fact, in the coding widgets that I have created for Q-SoPrA I have also included the possibility to highlight particular fragments of text that are to be associated with the codes (see below). Anyone who has used software like RQDA, Atlas.ti, NVivo, or MaxQDA will understand how this works.
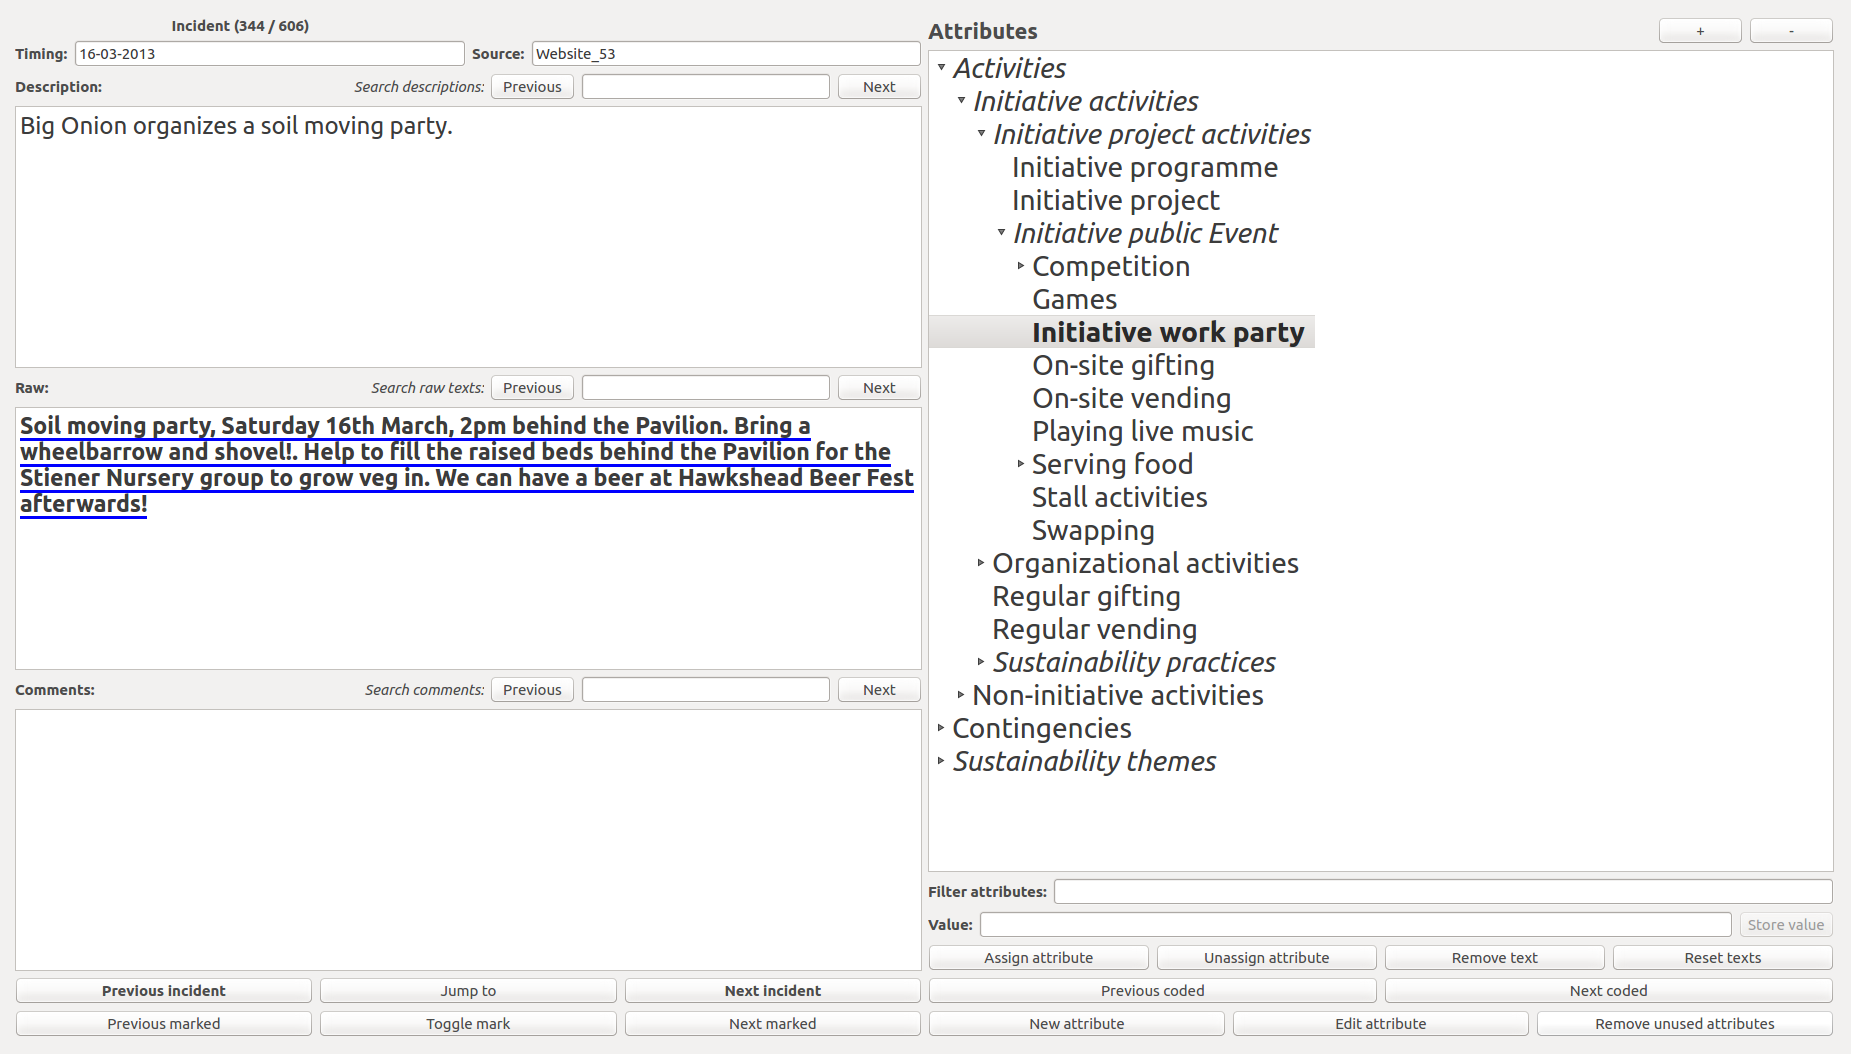
Q-SoPrA does not require the analyst to include fragments of raw data, because there is not guarantee that these are available in the form of text. For example, some of my raw sources of data are images. However, I would encourage anyone to include raw fragments as much as possible, if only because such fragments are a great help in the qualitative coding process. I have personally noticed that I have become much more precise in my coding after implementing the possibility to highlight fragments of text.
Comments by the researcher
Finally, in Q-SoPrA the analyst has the option to include comments, which may be anything from personal observations or thoughts on the incident, or perhaps reminders that certain aspect of the incident should be double checked (Q-SoPrA also offers the possibility to mark incidents, and to jump back and forth between incidents that were marked).
People that have experience with qualitative research (and particularly grounded theory) are probably familiar with the notion of memos. In Q-SoPrA, the comment field can be used to write such memos. Comment fields are the only fields related to incidents that can be altered at any time (the other incident-related fields, i.e., the indication of timing, the description, the sources of data, and the ‘raw’ data can only be changed from the Data Widget).
The structure of Q-SoPrA’s datasets
The structure of Q-SoPrA’s input datasets is quite simple: A data set is a table with 7 columns. Only 5 of these columns are visible to the user (see below), which are the columns that record the Timing, the Description, the Raw data, the Comments, and the Source(s) associated with incidents. The information included in these columns should be supplied by the analyst, by writing new incidents, or by importing data sets from external csv files (also see my previous post for a technical discussion on importing data from csv files).
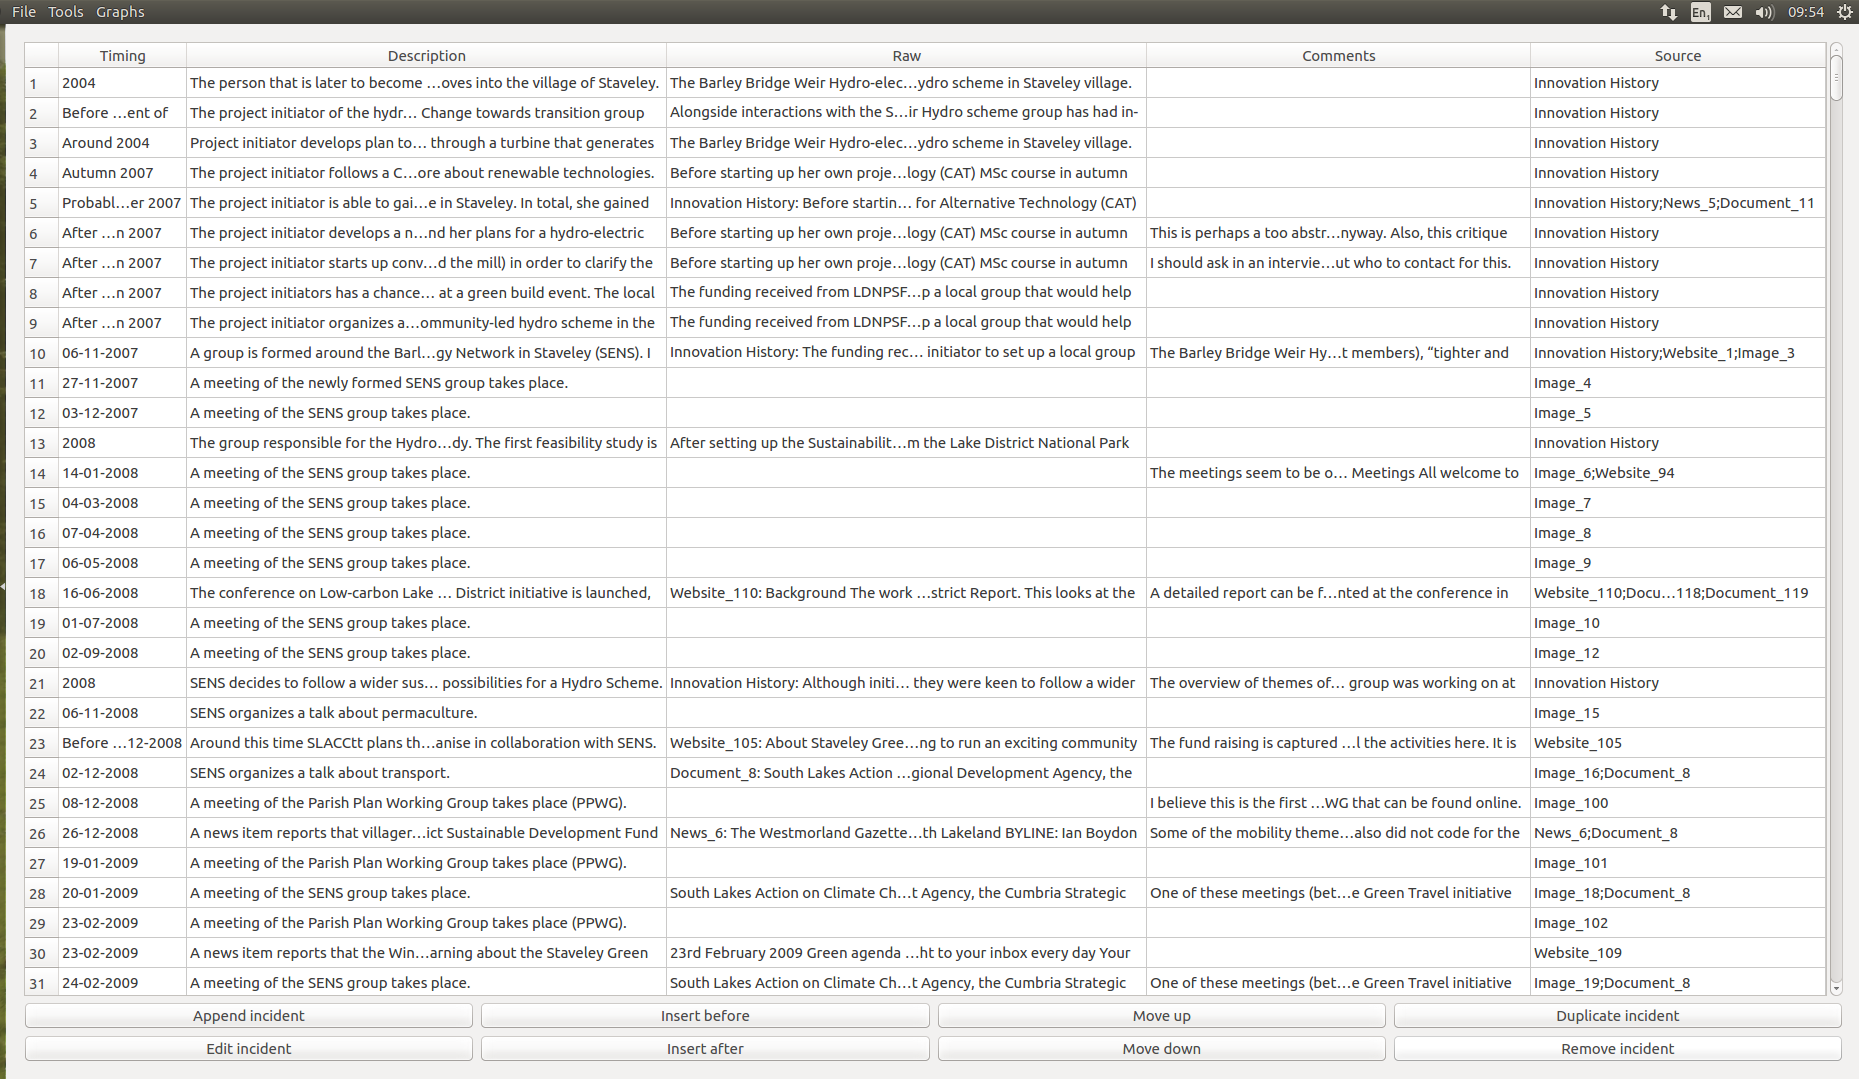
The other two columns of the table are hidden from the user, and are always created and filled automatically. The first of these columns holds a unique ID for the incidents. The unique incident IDs are of crucial importance, because Q-SoPrA uses these IDs to refer to incidents in other tables of Q-SoPrA’s database. A unique ID is created whenever an incident is added to a data set. The first incident in the data set has the ID ‘0’, the second has the ID ‘1’, and so on. To ensure that we never confuse incidents, Q-SoPrA never reuses an ID number that has already been used before in the same data set.
What are the incident IDs for?
Q-SoPrA uses sqlite databases to store all information that the user creates while working on a data set. These databases currently have 40 different tables (more may be added as I expand the program), but the only table that the user interacts with more or less directly is the table of incidents. Other tables are used, for example, to store the attributes that the user creates while coding, to store information on which attributes were assigned to which incidents, to store information on the fragments of text that have been associated with certain pairs of incidents and attributes, and so on. Obviously, it is important that Q-SoPrA knows which specific incidents we are referring to in these different tables, which is why we need unique IDs for all incidents.
The second column that is hidden from the user contains an order variable, which simply records the current position of an incident in the chronological order (the table of the data widget does show a row number, which always has the same value as the order variable). The value of this variable determines the position of an incident as it is shown to the user in the data widget (see the screenshot above). The value of this variable is changed whenever an incident is moved up our down in the table, which can be done from the data widget. Whenever the analyst performs such an operation, Q-SoPrA automatically calculates the new values of the order variable for the affected incidents. The values of the order variable also determine how the data are presented to the user in other widgets, such as the qualitative coding widgets. In addition, in the visualisation widgets the order variable can be used to filter visualisations to only visualise data from a particular episode in the process (I will discuss these topics in more detail in future posts).
Working with Q-SoPrA’s datasets
When you start up Q-SoPrA, you will always be shown a Welcome Dialog first (see screenshot below).
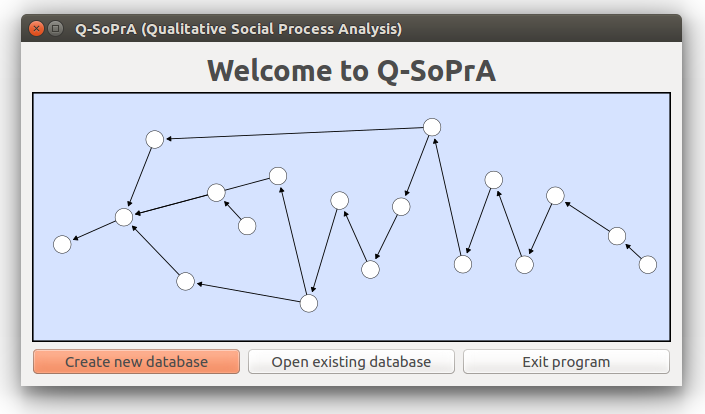
The Welcome Dialog gives you three options: (1) You can create a new database, (2) you can open an existing database, or (3) you can exit the program. If you select the first option, Q-SoPrA will open a file dialog, which you can then use to select the name and location for your new database. After doing so, a new sqlite database is created. Essentially, this database is just a large collection of (initially empty) tables, but nearly all information created by, and presented to the user while using Q-SoPrA is stored in these tables. If the user selects to create a new database, and then selects an existing database in the file dialog, then the existing data base will be overwritten. This action cannot be undone, but the user will be shown a warning dialog before proceeding.
The user can indeed also select to open an existing database. In this case, Q-SoPrA will not attempt to create a new database, but any tables that are missing from the existing database will be added.
After choosing to create a new database, or to open an existing one, Q-SoPrA’s main window will be opened, and the data widget will be shown. All other widgets can be accessed from the main window, using the window’s menu bar (see screenshot below). I will discuss these other widgets in future posts.
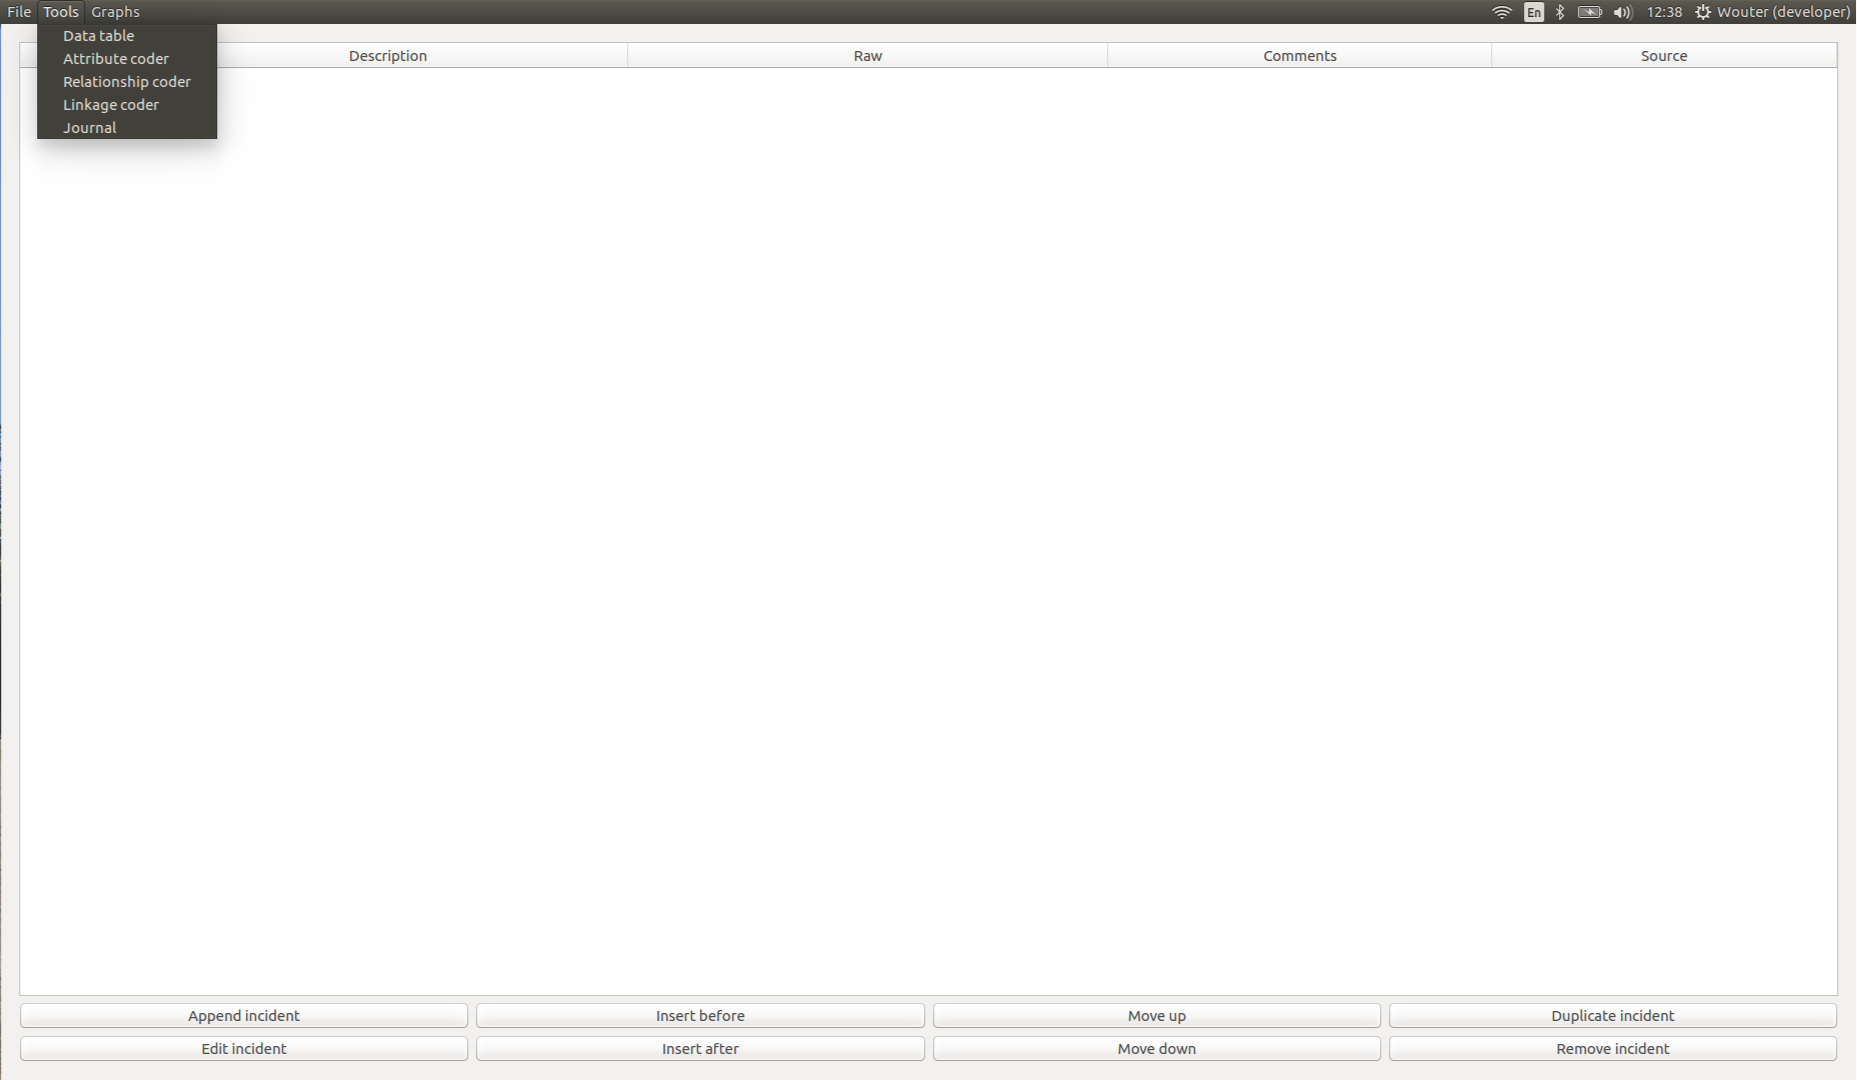
If the user selected to create a new dataset, then the data widget will simply show an empty table, as well as a few buttons that can be used to interact with the data set. From this point, the analyst can either start creating new incidents from scratch, or import incidents from an external csv file, which is done by selecting the appropriate option from the File menu in the menu bar.
Imported csv files should meet two main requirements: (1) the file should have the column headers that Q-SoPrA works with, and they should exist in the same order (“Timing”, “Description”, “Raw”, “Comments”, and “Source”), (2) cells of the “Timing”, “Description” and “Source” columns are not allowed to be empty. If the user attempts to import files that do not meet these requirements, an error dialog will be shown to inform the user that the data will not be imported and why.

If the user wishes to create new incidents from scratch, the option Append incident can be used to add a new incident to the end of the data set. The user will then be shown a new dialog that can be used to enter information on the incident (see screenshot below). The user is always required to enter information into the “Timing”, “Description” and “Source” fields. If these fields are empty, the user is not allowed to create the incident, and will be shown an error dialog that explains why.
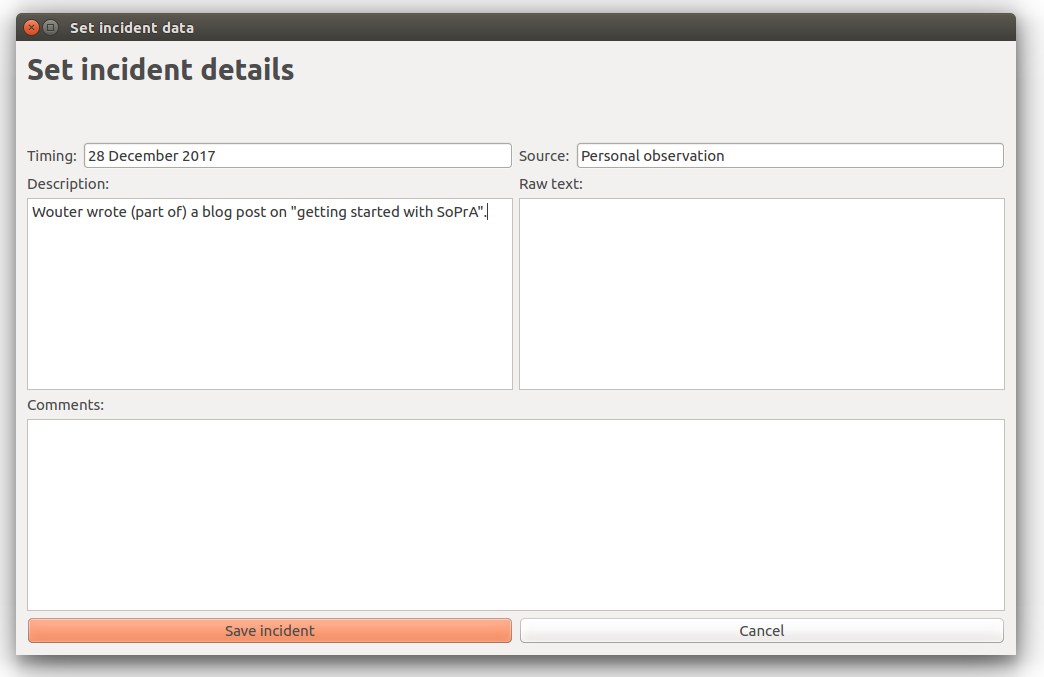
After saving the incident, it will be shown in the table of the data widget. The fields of the incident can now be manipulated by double clicking cells and changing the details. However, when the user clears a cell that is not allowed to be empty, Q-SoPrA will simply reset the cell. An incident can also be edited by selecting it, and then using the Edit incident option. This will open the same dialog that is used for the creation of new incidents, but the fields will be filled with the information that was already present.
Other minor features of the data widget table
The table in the data widget has various other features. For example, the information contained in a cell can be shown in a popup dialog by hovering the mouse cursor over it. This allows the user to display information on incidents without having to open another dialog. To the left of the table, the user will see a column with row numbers. The lower border of the cells in this column can be dragged up or down to decrease / increase the height of rows. The lower border of these cells can also be double clicked to maximise a row's height. If the user wishes to restore a row's height to its default value, the user should simply double click the corresponding cell with the row number. The user can also increase or decrease the table's font size by holding the CTRL button and scrolling the mouse wheel up or down.
Once the user has filled the table with some data, (s)he also might want to insert new incidents in between two existing ones, rather than appending them to the end of the table. For this reason, the user also has the option to insert a new incident before or after an existing one. These options work the same as appending a new incident (e.g., a dialog will be shown that can be used to enter information on the new incident), but the new incident will be inserted at the location chosen by the user.
Sometimes it also makes sense to duplicate an existing incident, and make only small adjustments to the duplicate, rather than having to enter all information again. For example, I often use this option if I decide to split up an existing incident into multiple incidents. This can be achieved by selecting an existing incident, and using the Duplicate incident option. The result will be similar to editing an incident, but in this case a new incident is created when saving the changes. Duplicates will always be inserted immediately after the incident that they are a duplicate of.
The user will occasionally want to change the order of the incidents (for example, after creating a duplicate). This can be done by selecting an incident, and using the Move up or Move down options. This will simply switch the selected incident with the one prior to it or the one following it.
Finally, the user can remove an incident from the table by using the Remove incident option. Removing an incident will also remove all information that has been associated with it, such as assigned attributes (not the attributes themselves), and linkages that have been created with other incidents (I discuss this in a future post). The user will always be shown a warning dialog when using this option, since it cannot be undone.
Getting started with Q-SoPrA
In conclusion, getting started with Q-SoPrA is easy. You simply create a new data set, and starting filling the data widget’s table with incidents. In my view, by building your data set you are basically building your case.
Indeed, while analysing the data you will often find yourself going back to the data widget to add more incidents, to edit, split or merge existing ones, or to change the order of the incidents. In my experience you will continue to do so throughout most of the analytic process, as your understanding of the case of interest gets more refined.
This is exactly the reason why the data widget was integrated into Q-SoPrA. In fact, the main reason I had for building Q-SoPrA was to have a program in which the tasks of data management and data coding are integrated (but things escalated quickly from there, as I kept adding other features to Q-SoPrA). Before building Q-SoPrA, I built several standalone tools that perform some of the tasks that Q-SoPrA performs (although Q-SoPrA performs these tasks much better, which is simply a result of my increased experience with coding software). One of the main problems with these standalone tools was that I often found myself having to re-import data sets after making small changes. Since this was quite a time-consuming and error prone process, I also often found myself postponing changes or ignoring certain flaws in the data set, simply because I did not want to waste too much time. One of the main ideas underlying Q-SoPrA is that management of the data set is actually a crucial part of the analytic process, and therefore I have attempted to make the process of going back and forth between your data and your analysis as painless as possible.
Of course, data management is only one part of what Q-SoPrA does, and the data widget is primarily a support for the various other tasks that can be performed with Q-SoPrA. I discuss these other tasks in future posts.
Enjoy Reading This Article?
Here are some more articles you might like to read next: