Drawing parallel edges in Qt
Introduction
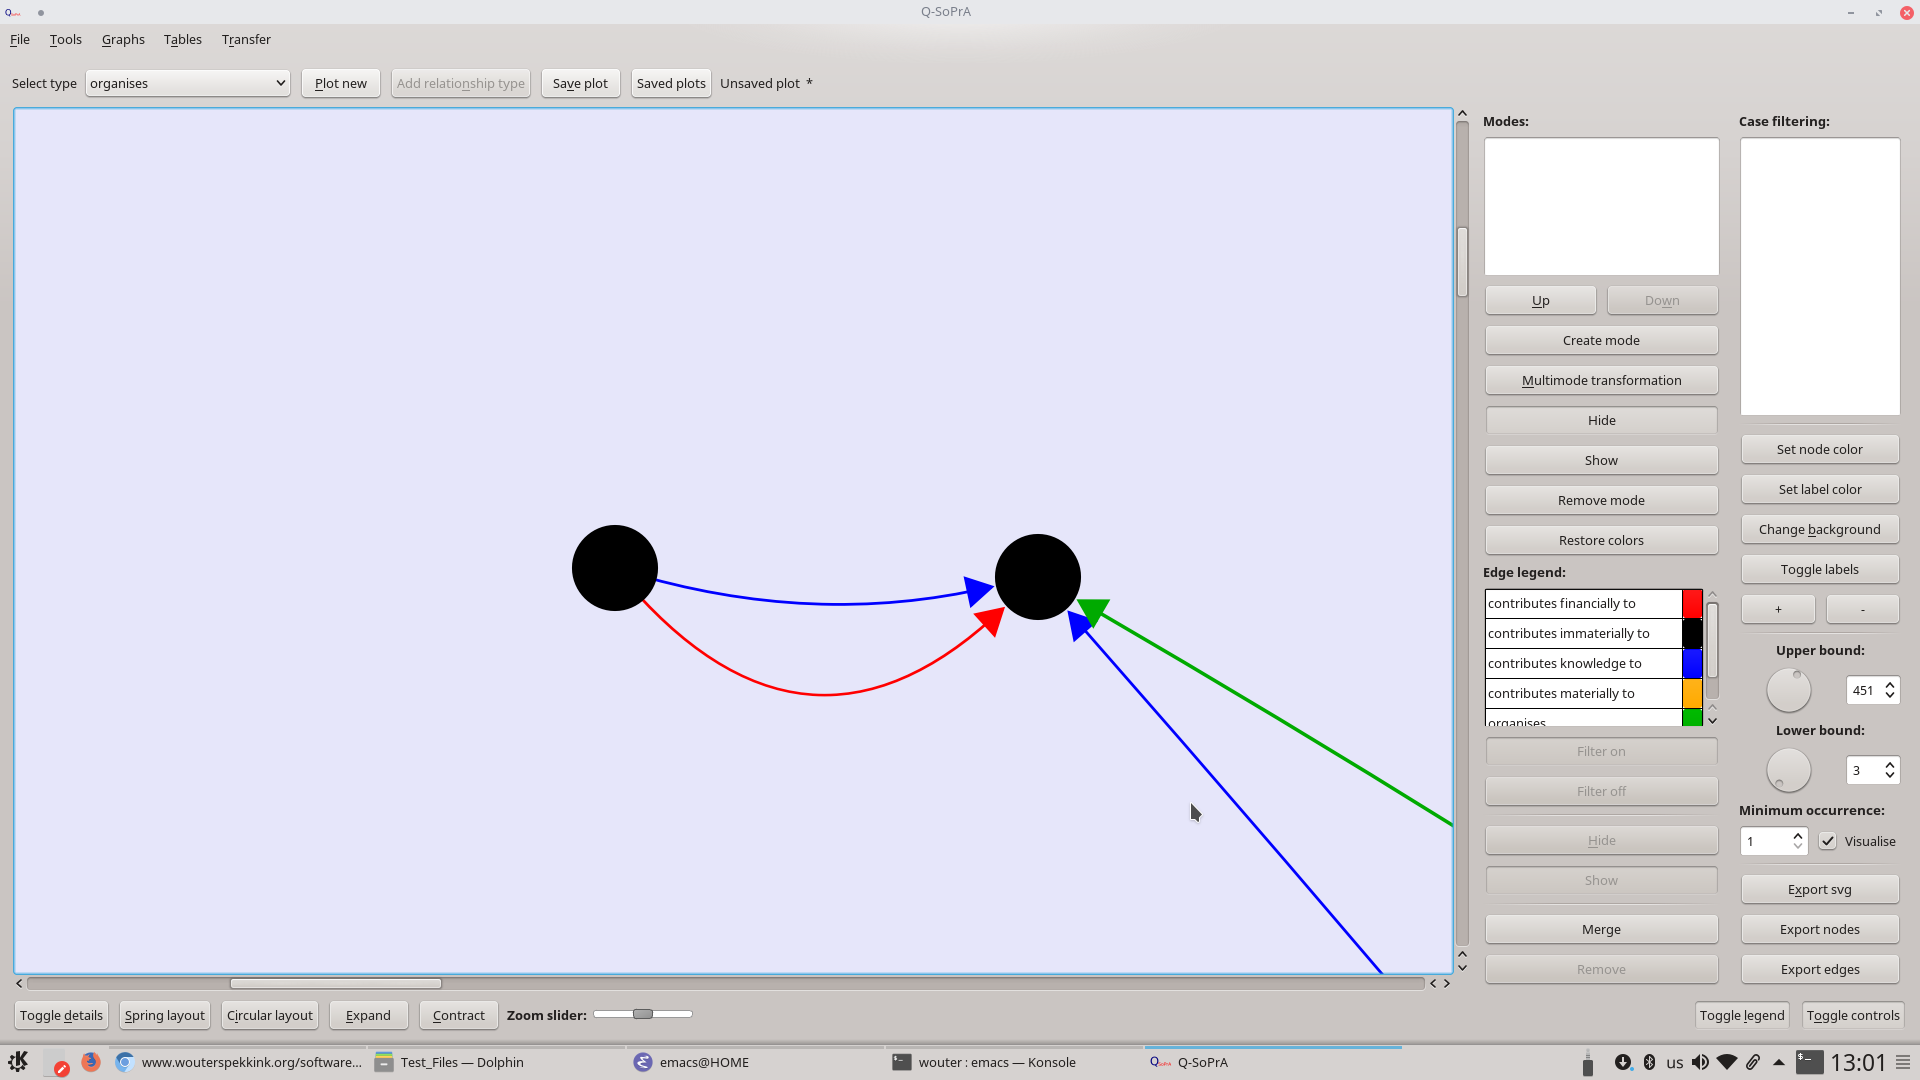
I wrote a non-technical post on relationships in Q-SoPrA. One of the things I discuss there is plotting parallel edges, that is, multiple edges between the same pair of nodes. This is something I definitely wanted to be able to do, since I am interested in looking at social arrangements (of people, places, things, etc.) that can be related to each other in various ways. If I want to look at multiple relationships at the same time, being able to visualise parallel edges is a necessity. In this post I discuss some of the details of visualising parallel edges using Qt’s tools for visualisation. For a visual impression of what parallel edges look like in Q-SoPrA, see the screenshot below.
Some things we need for drawing
In this post, I will be focusing almost exclusively on the drawing of edges, but I just want to briefly touch upon some of the other basic things we need in order to visualise them. Below you see a screenshot of the Network Graph Visualisation widget with all the menus unfolded. In the middle of this screenshot you see the space where the drawing actually happens. The drawing space itself is an object of the QGraphicsViews class, although I should add that in Q-SoPrA I use a sub-classed version in which I re-implemented many of the member functions of this class (the same goes for most other classes I discuss in this post). The QGraphicsView object visualises objects that are included in another object of the QGraphicsScene class (a QGraphicsScene object needs to be assigned to the QGraphicsView object). These classes are quite well documented in the Qt documentation, so I will not go into details here (also see this page to read more about the Graphics View Framework of Qt).
Also, I recently read this blog post, which seems to suggest that Qt Quick is a potential replacement for the Graphics View Framework.
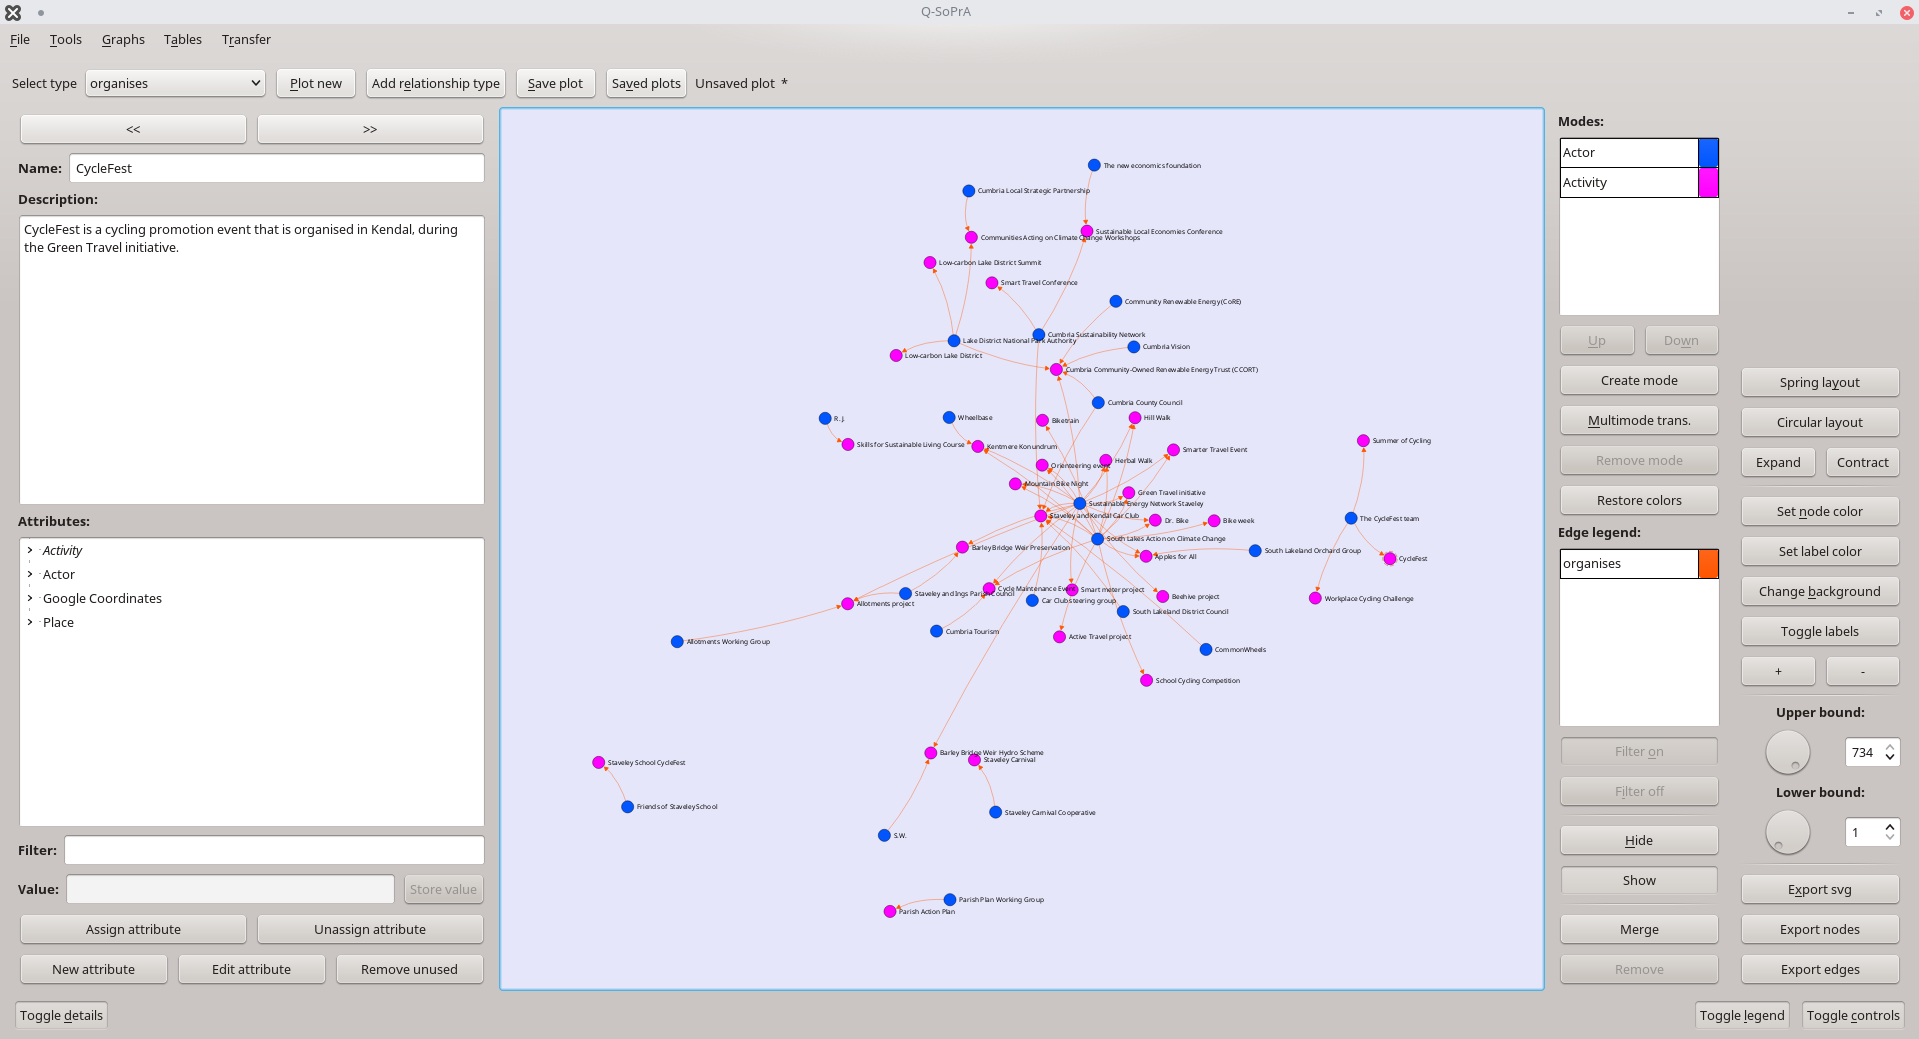
In the screenshot we also see that we have drawn objects in the drawing space. We can see nodes, we can see edges, and we can see labels. All these objects are items that are currently included (and visible) in the QGraphicsScene object. The nodes are objects of a sub-classed version of the QGraphicsItem class, the edges are objects of a sub-classed version of the QGraphicsLineItem class, and the labels are objects of a sub-classed version of the QGraphicsTextItem class.
So, the QGraphicsView, the QGraphicsScene and the QGraphicsItem are the three basic types of objects that you need to make visualisations like the ones included in Q-SoPrA. The QGraphicsItems are the things we want to visualise, the QGraphicsScene contains and manages these items, and the QGraphicsViews visualises the contents of the QGraphicsScene.
Drawing edges: some basics
Before I get into some specific challenges related to drawing parallel edges, it is useful to briefly discuss what goes into drawing a basic edge. There are a few basic properties of edges that we need to take into account:
- An edge is mostly a line with a starting point (the centre of a source node) and an end point (the centre of a target node). Where we draw an edge will depend on where its source and target nodes are located. We thus need to somehow explicitly relate source and target nodes to edges, so that the edges can check their nodes’ locations before ‘drawing themselves’.
- To indicate the direction of edges we use arrowheads. We thus need a way to draw these, which is a bit more complicated than just drawing a line.
- The arrowhead should point at the target node, which means that the line we attach it to should stop a small distance before it reaches its end point. Otherwise the arrowhead would simply overlap with the target node (see screenshot below; I set the z-level of the source node lower than that of the edge to make clear from where to where we draw the edge’s line).

In Qt’s documentation you can find the Diagram Scene example that achieves almost exactly this (see especially the header file and the cpp file of the Arrow class used in this example). The objects that Q-SoPrA uses to draw edges are inspired by this example, although the classes ended up looking quite different due to various specific requirements I had for my own class. The class I developed is called DirectedEdge, and it is what I will focus upon in the remainder of this post.
Let us first take a look at the constructor of the DirectedEdge class. Here is a code snippet from which I have removed some details that are not important for the examples in this post.
DirectedEdge::DirectedEdge(NetworkNode *startItem, NetworkNode *endItem, QString submittedType,
			   QString submittedName, QGraphicsItem *parent)
  : QGraphicsLineItem(parent)
{
  start = startItem;
  end = endItem;
  color = Qt::black;
  setPen(QPen(color, 2, Qt::SolidLine, Qt::RoundCap, Qt::RoundJoin));
  height = 20;
  relType = submittedType;
  name = submittedName;
  filtered = true;
  massHidden = false;
  setFlag(QGraphicsItem::ItemSendsGeometryChanges);
  comment = "";
}
As you can see, we are passing pointers to objects of the NetworkNode class to the constructor of DirectedEdge. The NetworkNode class is a sub-classed version I created of the QGraphicsItem class, and I use this class to draw the nodes of my network diagrams. When we add NetworkNodes (or any other QGraphicsItem to a QGraphicsScene object, then these will be assigned a scene position, that is, a point in the scene that is defined by an x-coordinate and a y-coordinate. We can access the scene position of a NetworkNode (or other types of QGraphicsItems) by using the ‘scenePos()’ member function. This will return a ‘QPointF’ object that contains the item’s coordinates. So, if we want to know from where to where to draw a certain edge, the obvious thing to do would be to first find the scene positions of its start node - start->scenePos() - and end node - end->scenePos() - and then draw the line between those two positions.
As I mentioned before, we actually want our line to stop shortly before it reaches its end point. What we could do is to create a QLineF object, passing our start and end points as parameters, and then use the setLength() function to make the line slightly shorter: myLine.setLength(myLine.length() - 18).
Then we still need to add our arrowhead. For this, I simply followed the Diagram Scene Example provided in the online documentation for Qt. Basically, this involves creating a QPolygonF object with the shape of our arrowhead, and have this object drawn near the end point of our line.
We should do most of the above in the ‘paint()’ function of our edge, because that is the function where we determine where and how the edge is drawn. I have included a code snippet below to illustrate what our paint() function might look like in this scenario.
const qreal Pi = 3.14;

void DirectedEdge::paint(QPainter *painter, const QStyleOptionGraphicsItem *, QWidget *) {
  QPen myPen = pen(); // We need to create a pen for our painter...
  myPen.setColor(color); // ...and indicate which colour it will use.
  painter->setPen(myPen); // Now we set the pen to your painter.
  QLineF myLine = QLineF(start->scenePos(), end->scenePos()); // Here we create our line.
  myLine.setLength(myLine.length() - 20); // We shorten our line.

  // And then we create our arrowHead.
  qreal arrowSize = 10.0;
  QPointF arrowP1 = myLine.p2() - QPointF(sin(angle + Pi /3) * arrowSize,
    cos(angle + Pi / 3) * arrowSize);
  QPointF arrowP2 = myLine.p2() - QPointF(sin(angle + Pi - Pi / 3) * arrowSize,
  cos(angle + Pi - Pi / 3) * arrowSize);

  arrowHead.clear();
  arrowHead << myLine.p2() << arrowP1 << arrowP2;

  painter->drawLine(myLine);
  painter->drawPolygon(arrowHead);
}
And that should do the trick. At least, if we were only interested in drawing edges as straight lines. However, what if we want to draw parallel edges, that is, multiple edges between the same pair of nodes? In this case, if we would just use straight lines, then the edges would overlap, and we would actually not be able to see that multiple edges exist between our nodes. In this case, it is better to draw edges as curved lines, and to change the strength of the curve for each additional edge that we add to a given pair of nodes. The remainder of this post will be about how we can do this, and what challenges we will face.
Drawing parallel edges
Drawing a curved line with the Qt library is not difficult to do. One of the easiest ways to paint() a curved line is by creating a QPainterPath object, and use its quadTo() function. This function takes two arguments: One of the arguments is the end point that we want to draw the curved line to, and the other argument is a so-called control point that we will use to determine how the line will be curved (how strong the curve will be and which direction it will curve in). We do not give the function a starting point. Instead, we should move the QPainterPath object to our starting point using its ‘moveTo()’ function before calling the quadTo() function.
So, what about this control point? Consider the image I have linked to below (found through this Stack OverFlow discussion). The image shows nicely how the control point works. It is a point somewhere ‘above’ the place where we want our line to curve towards the control point. In the image you see that if we place the control point somewhere above the middle of the line, then the line will also curve around its middle point. This is exactly what I wanted for my parallel edges. In the image you also see that the curve will change if we move the control point closer to the starting point or the end point. This is something that I want to avoid.
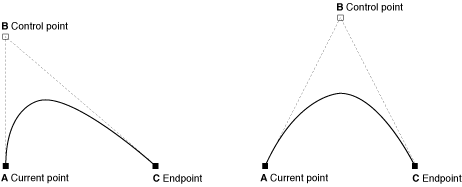
So far so good. Assume that our starting point is at coordinates (0, 5) in the scene, and our end point is at coordinate (10, 5) in the scene, we can first simply calculate the point that lies exactly in between them: x = (10 + 0) / 2 = 5 and y = (5 + 5) / 2 = 5, giving us the point at coordinates (5, 5). Then we still need to set the ‘height’ of the curve, which, in this case, we can do simply by adding some constant to the y-coordinate of our middle point, giving us, for example, the point at coordinates (5, 25). If we then pass this point to the quadTo() function, we will get a nice curved line.
This example was relatively simple, because the slope of the straight line between our starting point and our end point is 0. This makes finding the control point relatively straightforward. However, consider now that we have a line that starts at coordinates (0, 5) and ends at coordinates (10, 10). Finding the point that lies exactly in the middle is still quite easy: x = (0 + 10) / 2 = 5 and y = 5 + 10 / 2 = 7.5. However, how do we now find the control point, somewhere ‘above’ this middle point? We cannot simply add a constant value to the y-coordinate of our middle point, because that would place the control point somewhere right from the middle of the line, and create a curve that skews to the left (similar to the left part of the picture above, where the line is skewed to the right).
There are multiple possible solutions here. One thing we could do is to simply (1) calculate the distance between the start point and end point of the edge (using the pythagorean theorem), (2) draw an imaginary straight line from our start point with a slope of 0 (that is, parallel to our x-axis), and with a length that equals the distance we measured in step 1, (3) create a curved edge from the start and end point of our imaginary straight line, using the procedure described above, (4) calculate the angle between our imaginary straight line and the sloped line from our original starting point to our original end point, and then (5) rotate() the painter by the number of degrees of that angle before drawing our edge. In effect, we are just drawing a curved edge between two points on a horizontal line, and we are then rotating that edge before it is drawn, thereby changing its end point. This is the solution I used for a while, because it is relatively simple to implement. However, it does cause some complications for calculating the bounding rect and the shape of the edge, because we are essentially working in multiple coordination systems. I will not discuss these complications in detail here, but it is important to know that they can cause unwanted behaviour in visualisations.
There is another, better solution that I eventually switched to after experiencing issues with my first solution. This solution starts with drawing an imaginary straight line between the start and the end points of our edge. We then calculate the midpoint of our line, as before. Then we draw a straight line perpendicular to our first line that crosses our midpoint, and we pick a point on that line as our control point. This sounds relatively straightforward, but it took me some time to figure out how to properly implement the formula for setting the control point.
Rather than including all these steps in the ‘paint()’ function of our edge, I wrote a separate calculate() function that makes the necessary calculations, and is called by the paint function (as well as by other functions that require knowledge of the control point’s position). See the two functions in the code snippet below.
void DirectedEdge::calculate()
{
  // We first calculate the distance covered by our edge
  qreal dX = end->pos().x() - start->pos().x();
  qreal dY = end->pos().y() - start->pos().y();
  qreal distance = sqrt(pow(dX, 2) + pow(dY, 2));
  // Then we create a straight line from our start point to our end point and shorten its length
  QLineF newLine = QLineF(start->pos(), end->pos());
  newLine.setLength(newLine.length() - 18);
  // Then we calculate the coordinates of our midpoint
  qreal mX = (start->pos().x() + newLine.p2().x()) / 2;
  qreal mY = (start->pos().y() + newLine.p2().y()) / 2;
  // And the coordinates of our control point. We use the edges height as a scaling factor
  // to determine the 'height' of the control point on a line perpendicular to our
  // original line (newLine).
  qreal cX = height * (-1 * (dY / distance)) + mX;
  qreal cY = height * (dX / distance) + mY;
  controlPoint = QPointF(cX, cY);
  // We create another line from our control point to our end point and shorten its length
  ghostLine = QLineF(controlPoint, end->pos());
  ghostLine.setLength(ghostLine.length() - 18);
  // Then we do the calculations we need to create our arrowhead
  double angle = ::acos(ghostLine.dx() / ghostLine.length());
  if (ghostLine.dy() >= 0)
    angle = (Pi * 2) - angle;
  qreal arrowSize = 10;
  arrowP1 = ghostLine.p2() - QPointF(sin(angle + Pi /3) * arrowSize,
				     cos(angle + Pi / 3) * arrowSize);
  arrowP2 = ghostLine.p2() - QPointF(sin(angle + Pi - Pi / 3) * arrowSize,
				     cos(angle + Pi - Pi / 3) * arrowSize);
  // We set the new line as the line for this edge object and communicate that we
  // are about to change the objects geometry (this will makes sure the bounding rect
  // is reset as well.
  setLine(newLine);
  prepareGeometryChange();
}

void DirectedEdge::paint(QPainter *painter, const QStyleOptionGraphicsItem *, QWidget *)
{
  // We have to set a pen and its colours.
  QPen myPen = pen();
  myPen.setColor(color);
  painter->setPen(myPen);
  painter->setBrush(color);
  // We call the calculate function outlined above.
  calculate();
  // We create the arrowhead, using ghostLine (from the control point to slight before the end point)
  // to determine the direction from which the arrow is pointing.
  arrowHead.clear();
  arrowHead << ghostLine.p2() << arrowP1 << arrowP2;
  // We create a path object as a based for our curved edge.
  QPainterPath myPath;
  // We move this path to the start point of our edge.
  myPath.moveTo(start->pos());
  // The we create a bezier curve to our end point, using the control point to curve it
  myPath.quadTo(controlPoint, ghostLine.p2());
  strokePath = myPath;
  // And then we draw the arrowhead and the curved line
  painter->drawPolygon(arrowHead);
  painter->strokePath(myPath, QPen(color));
}
A few other things to note about these functions
In addition to finding the control point (which I explained above how to do), there are a few other things we need to do to make sure that we end up with nice looking curved edges. First of all, we might have 3 or more parallel edges between the same nodes. If we want to make all edges visible, we need to increase the strength of the curve for each parallel edge that we add (to prevent them from overlapping). That is what the height scaling factor in the snippet above is used for. This height has to be set explicitly, for which I wrote a very simple function. Then it is simply a matter of keeping track of what edges we already have in our scene and to make sure that the heights of the curves of our edges are adjusted accordingly. This is something that needs to be handled at a higher level, and I will not discuss it any further here.
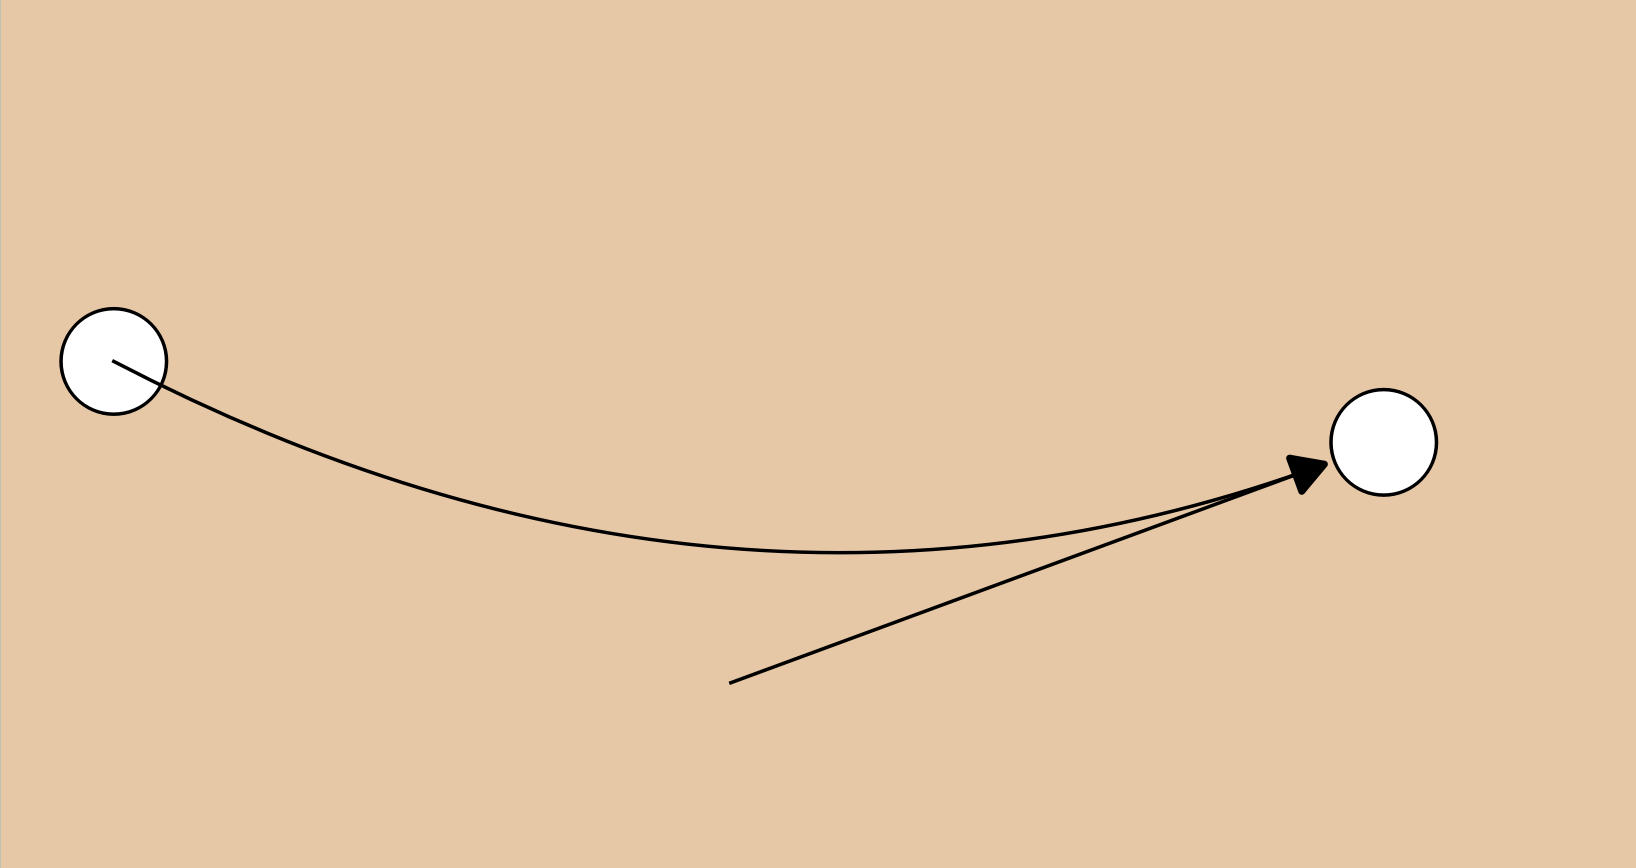
We also need to make sure that our arrowhead actually points from the right direction. If we would attach our arrowhead to the original line we draw from the start point to the end point, it would make an awkward angle, as shown in the screenshot below.
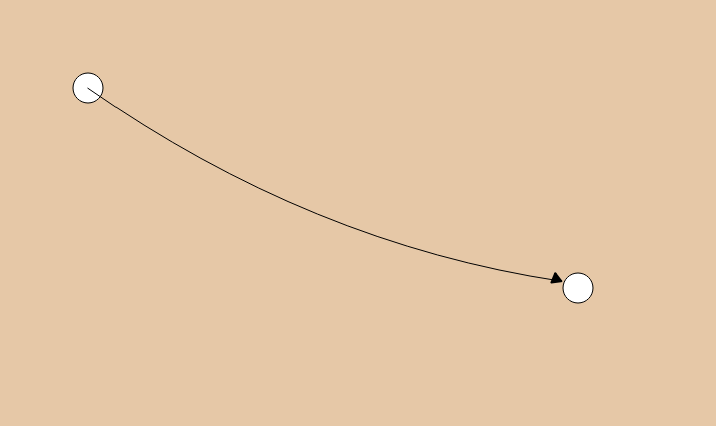
This is relatively easy to correct with the resources that we already have. In the code snippet that I included above, you will see that I created an object that I called ghostLine, which is a line that runs from the control point that we calculated for the bezier curve to the end point of the edge (minus a small distance to prevent the line from overlapping with the node). This ghostLine is useful for determining where the curved edge should end, as well as for determining the angle that the arrowhead should point from. Essentially, what we can do is attach the arrowhead to the ghostLine and draw the arrowhead, but not draw the line itself. For illustrative purposes, I included a screenshot below where the ghostLine is drawn, so that you can get an idea of how it helps to determine the angle of the arrowhead.
Final comments
And that is it. The code snippets above contain the most essential ingredients for drawing curved edges within the Qt Framework. Indeed, there is plenty of stuff that goes on around this that needs to be implemented for all of this to work. Later this year, the source code for Q-SoPrA will be open, which gives you the opportunity to examine the code in more detail.
Enjoy Reading This Article?
Here are some more articles you might like to read next: